This week is all about Windows Defender Application Control (WDAC). That’s not a new subject for this blog. The main difference, however, with previous posts is that this time the focus will be on monitoring the different events when the WDAC policy is running in audit mode. Audit mode enables IT administrators to discover applications, binaries, and scripts that are missing from the configured WDAC policy, but actually should be included. Instead of the action actually being blocked, audit mode will only write an event in the Event Log. Those events can be used to further tune the WDAC policy, and to make sure that it’s production ready. For centrally logging that event information, this blog will be relying on using the the Azure Monitor agent on Windows devices. That agent can be configured to retrieve the required Event Logs. This post will provide information about distributing the Azure Monitor agent, creating the Data Collection Rule and creating and associating the Monitored Object. This post will mainly focus on exploring and analyzing the collected data.
Note: For some of the required pieces, this post relies on information that has been published here before. In those cases, this post will refer to that already published content.
Distributing the Windows Defender Application Control policy
Before looking at collecting data by using the Azure Monitor agent, it’s important to make sure that the data is available. In this case, that means that it’s important to make sure that a WDAC policy in audit mode, is distributed to the devices in the environment. For the best experience, in combination with Microsoft Intune, the best idea is to create a custom WDAC policy, to convert that custom WDAC policy, and to distribute that WDAC policy by using a custom device configuration profile. For more details around that process, look at the example that is documented here.
Distributing the Azure Monitor agent
When looking at collecting data by using the Azure Monitor agent, the first action is to make sure that the agent is distributed to the required devices. The installer for that agent is available for download here. The best method to deploy that installer, by using Microsoft Intune, is as a Win32 app. That method enables the creation of a flexible installation method for making the Azure Monitor agent available on devices. Before creating the app within Microsoft Intune, the Microsoft Intune Win32 App Packaging Tool should be used to wrap the installation file (AzureMonitorAgentClientSetup.msi) in an .intunewin file. Those steps are pretty straight forward when starting the app packaging tool. Once the wrapping was successful, the Win32 app can be added to Microsoft Intune. More details around the required steps are documented here.
Note: The Visual C++ Redistributable version 2015 or higher is a prerequisite and can be configured as dependency.
Creating the Data Collection Rule
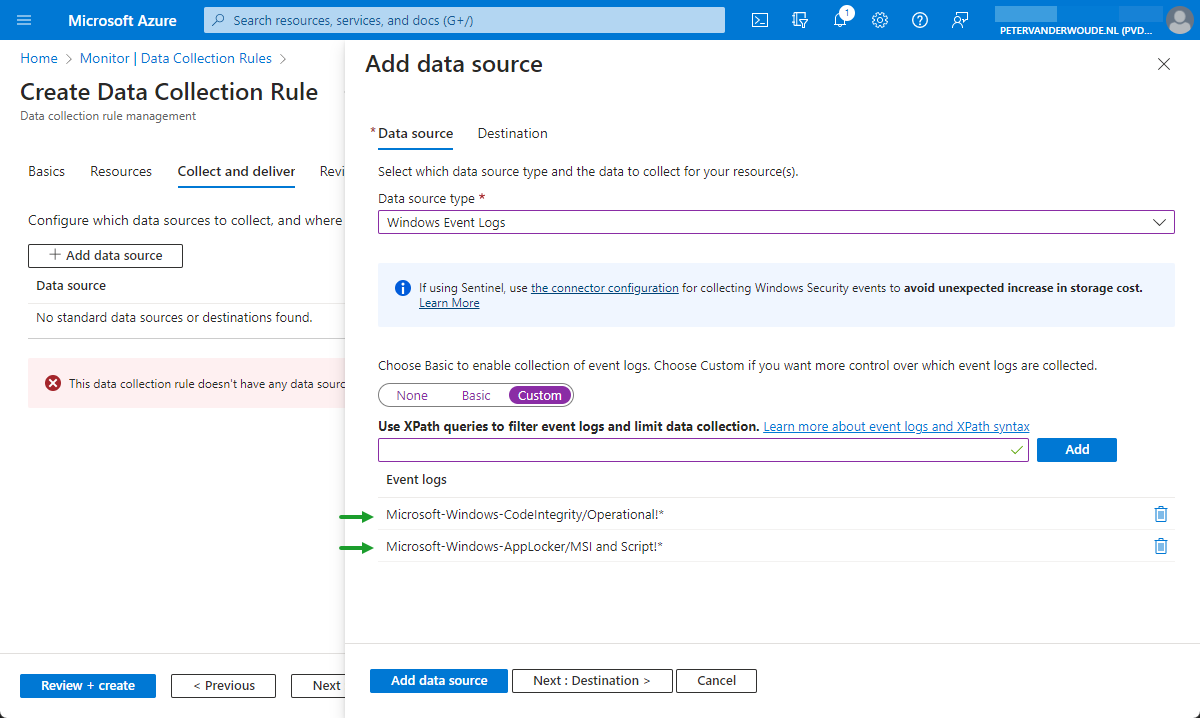
When looking at collecting data by using the Azure Monitor agent, the second action is to create a Data Collection Rule. That rule is used for specifying the data that should be collected. The important information around binaries is logged in the Microsoft-Windows-CodeIntegrity/Operational event log, and the important information around scripts and MSIs is logged in the Microsoft-Windows-AppLocker/MSI and Script event log. That information is the most important to capture, when looking for the impact of a new WDAC policy. The following five steps walk through the process of creating a Data Collection Rule that is used for collecting the information from the specified Event Logs.
- Open the Azure portal, navigate to Monitor > Data Collection Rules and click Create
- On the Basics page, specify a Rule Name, select the Subscription, select the Resource Group, select the Region, select Windows as the Platform Type and click Next: Resources
- On the Resources page, click Next: Collect and deliver
- On the Collect and deliver page, click Add data source, provide te following information and click Review + create
- On the Data source tab, provide the following information
- Data source type: Select Windows event logs
- Select Custom and provide Microsoft-Windows-CodeIntegrity/Operational!* and Microsoft-Windows-AppLocker/MSI and Script!* as the XPath query to filter
- On the Destination tab, select the Destination type, the Subscription and the Account or namespace
- On the Data source tab, provide the following information
Note: This XPath query will filter and limit data collection to events that match the query.
- On the Review + create page, click Create
Creating and associating the Monitored Object
When looking at collecting data by using the Azure Monitor agent, the third action is to create and associate a Monitored Object. That Monitored Object is used to create a representation of the Azure AD tenant in Azure Resource Manager (ARM). The earlier created Data Collection Rule must be associated with that object. That association can currently only be done at Azure AD tenant scope and makes sure that devices running the Azure Monitor agent will start collecting and sending data. Currently the best method for creating and associating that Monitored Object, is using PowerShell. More details around the required steps, in PowerShell, are documented here.
Analyzing the collected data
After making sure that the WDAC policy is configured and distributed, and the required Event Logs are collected, it’s time to have a closer look at the collected data. To get closer to a production ready WDAC policy, it’s important to know what data to look at. While in audit mode, the most important events are Event ID 3076 in the Microsoft-Windows-CodeIntegrity/Operational event log and Event ID 8028 in the Microsoft-Windows-AppLocker/MSI and Script event log. Those specific events indicate an action that would have been blocked when the WDAC policy was enforced. For a better picture, let’s zoom in on the first event.
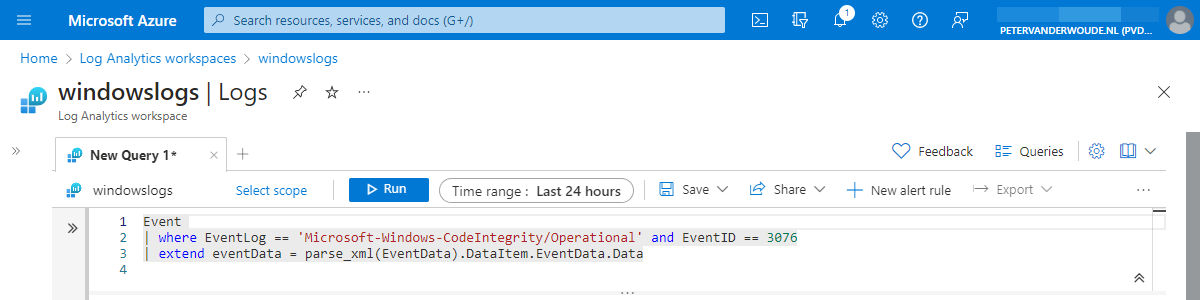
It starts by making sure that the collected data is filtered to only the specific Event ID from the specific Event Log. That is still pretty straight forward and can be achieved by filtering on the columns of EventLog and EventID, as shown below.
Event
| where EventLog == 'Microsoft-Windows-CodeIntegrity/Operational' and EventID == 3076
Now the data is filtered to only the rows of data that are really interesting when the WDAC policy is still in audit mode. The most interesting and detailed data, however, is available in XML-format in the EventData column. That’s were it becomes a bit more challenging. Luckily, KQL contains the parse_xml function to convert the value to a JSON. That makes it a lot easier to jump through the different slots within the created object to the interesting values, as shown below in Figure 2.
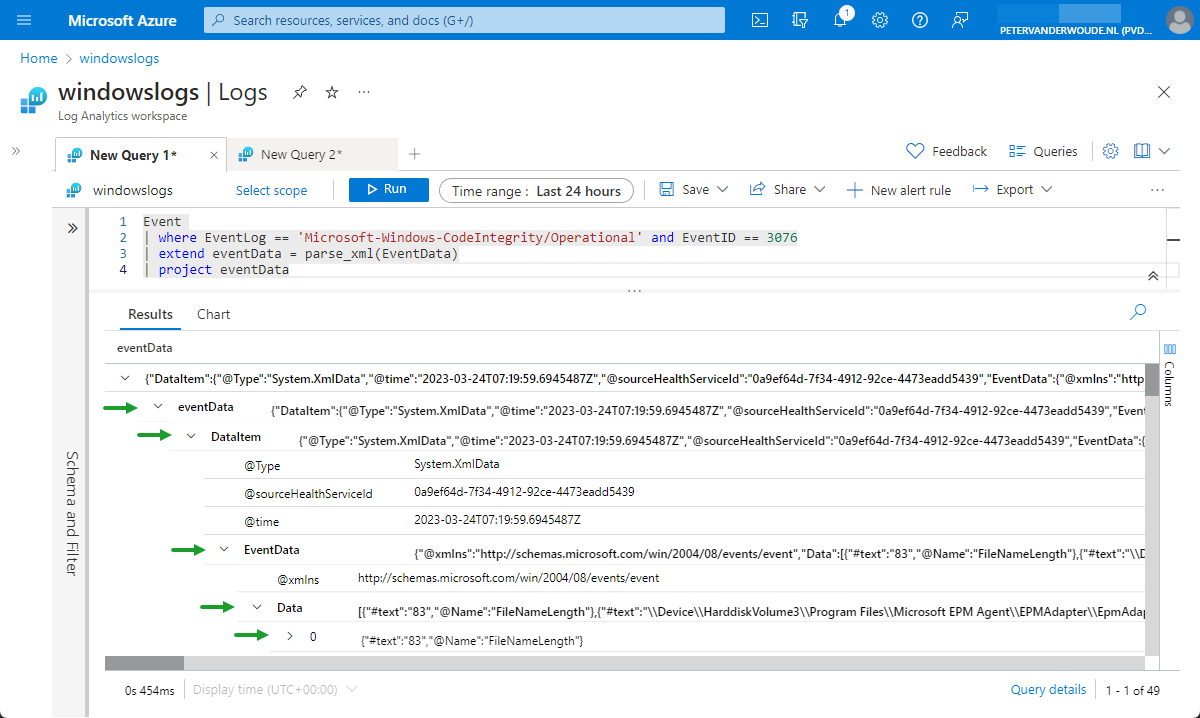
That figure also shows what happens with the data after parsing the XML-format. Besides that, it provides a good overview of the data in JSON and how to jump through the different slots. The data about the different events is available within the Data slot. Now the location of that slot is known, it’s relatively to extend the query with that slot, as shown below.
Event
| where EventLog == 'Microsoft-Windows-CodeIntegrity/Operational' and EventID == 3076
| extend eventData = parse_xml(EventData).DataItem.EventData.Data
Now the data is filtered to the point were it becomes more and more interesting and usable, as shown below in Figure 3.
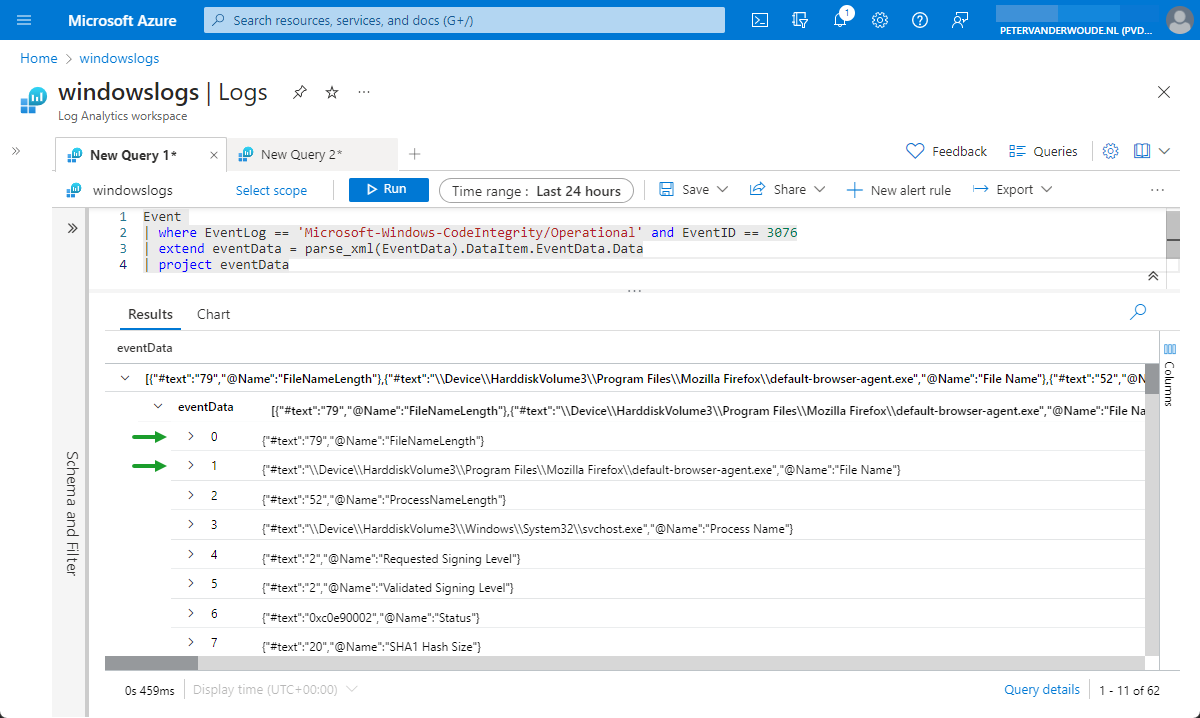
That figure shows what data is all available within the XML in the EventData column. It also still shows two interesting things that can be done to get even more usable data. The first thing is that all the data is available within numbered text items. Those number items are the same for every event from the collected log and can be queried by using [{number}]['#text']. The second thing is that some items contains file paths. Luckily, KQL contains the parse_path function to extract the filename from the directory path. That makes it easier to get the interesting parts, as shown below.
Event
| where EventLog == 'Microsoft-Windows-CodeIntegrity/Operational' and EventID == 3076
| extend eventData = parse_xml(EventData).DataItem.EventData.Data
| extend fileInfo = parse_path(tostring(eventData.[1]['#text']))
Now the data is filtered to the interesting parts and the different functions are known to get the pieces of data that are interesting. That knowledge can be used to create a KQL query that will provide the most interesting data points that are available within Event ID 3076 of the Microsoft-Windows-CodeIntegrity/Operational event log, as shown below. Something similar can be achieved for Event ID 8028 of the Microsoft-Windows-AppLocker/MSI and Script event log.
Event
| where EventLog == 'Microsoft-Windows-CodeIntegrity/Operational' and EventID == 3076
| extend eventData = parse_xml(EventData).DataItem.EventData.Data
| extend fileInfo = parse_path(tostring(eventData.[1]['#text']))
| extend fileName = fileInfo.Filename
| where fileName endswith ".exe"
| extend filePath = fileInfo.DirectoryPath
| extend fileDescription = eventData.[28]['#text']
| extend fileVersion = eventData.[31]['#text']
| extend fileHash = eventData.[10]['#text']
| extend processInfo = parse_path(tostring(eventData.[3]['#text']))
| extend processName = processInfo.Filename
| extend processPath = processInfo.DirectoryPath
| extend policyName = eventData.[18]['#text']
| extend productName = eventData.[30]['#text']
| project Computer, UserName, fileName, fileVersion, fileDescription, filePath, fileHash, processName, processPath, policyName,  productName
With all of this information, it becomes relatively easy to create some small workbooks for further analyzing the data. Adding some counters to find the most impactful adjustments, or adding some click throughs for additional data.
More information
For more information about the Azure Monitor agent, refer to the following docs.
- Set up the Azure Monitor agent on Windows client devices – Azure Monitor | Microsoft Learn
- Configure data collection for the Azure Monitor agent – Azure Monitor | Microsoft Docs
- Use audit events to create WDAC policy rules (Windows) | Microsoft Learn
- Understanding Application Control event IDs | Microsoft Learn
This looks great! Now how do we get the information into WDAC policy?
https://learn.microsoft.com/en-us/windows/security/threat-protection/windows-defender-application-control/wdac-wizard-parsing-event-logs#mde-advanced-hunting-wdac-event-parsing
Thank you, Ben! Also, thank you for the provided link with information.
Regards, Peter