This week is another post about one of the new Intune Suite add-on capabilities. This time it’s all about Advanced Endpoint Analytics. Advanced Endpoint Analytics adds-on to Endpoint Analytics by providing organizations access to more intelligence to gain even deeper insights into the user experience. It provides IT administrators with the tools to proactively detect and remediate issues that impact user productivity. All of that can be achieved with the new capabilities that are part of Advanced Endpoint Analytics. Those capabilities are anomaly detection, enhanced device timeline, and device scopes. Three powerful capabilities that enable IT administrators to use machine learning to identity anomalies, to have a detailed device timeline, and to have the ability to look at a specific set of devices. When an organization has the required licenses in place, these powerful capabilities will automatically become available. This post will help with understanding what anomaly detection and the enhanced device timeline can mean for an organization, and will show how to work with device scopes.
Note: In the near future, Microsoft is planning to introduce more AI-powered workloads in Microsoft Intune.
Understanding anomaly detection
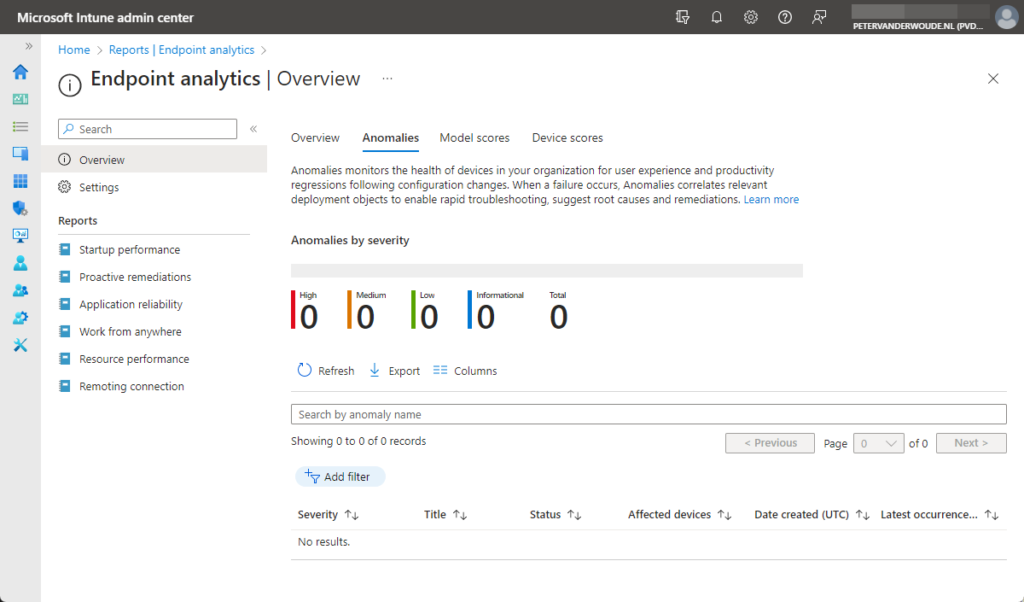
Anomaly detection is a great addition to the overview of Endpoint analytics. It monitors the health of the Windows devices in the organization for any regression in the user experience and productivity after any configuration changes. When any failure occurs, anomaly detection can correlate relevant deployment objects that enable IT administrators to quickly troubleshoot, suggest root causes and remediations. That provides IT administrators with data that they can rely on to learn about issues impacting the user experience, before actually being reported by the users. So, detecting a potential problem before it becomes an actual problem. That enables IT administrators to proactively address the situation. Below in Figure 1 is an overview of the anomalies in a boring environment. It does show clearly, however, what type of information can be expected.

Note: With the initial release, anomaly detection is focused on application crashes/hangs and stop error restarts.
To provide IT administrators with the data about anomalies, Microsoft relies on analytical models that detect device cohorts facing anomalous set of stop error restarts and application crashes/hangs. The following models are used:
- Threshold based heuristic model: The heuristic model involves setting one or more threshold values for application crashes/hangs or stop error restarts. Devices are flagged as anomalous if there’s a breach in the above set threshold. The model is simple yet effective; it’s suited in surfacing prominent or static issues with devices or their apps. Currently, the thresholds are pre-determined without an option to customize.
- Paired t-tests model: Paired t-tests are a mathematical method that compares pairs of observations in a dataset, looking for a statistically significant distance between their means. Tests are used on datasets that consist of observations related to each other in some way.
- Population Z-score model: Population Z-score based statistical models involve calculating the standard deviation and mean of a dataset, and then using those values to determine which data points are anomalous. Standard deviation and mean are used to calculate the Z-score for each data point, which represents the number of standard deviations away from the mean. Data points that fall outside a certain range are anomalous. This model is well suited in highlighting outlier devices or apps from the wider baseline but requires sufficiently large datasets to be accurate.
- Time Series Z-score model: Time series Z-score models are a variation of the standard Z-score model designed for detecting anomalies in time series data. Time series data is a sequence of data points collected at regular intervals over time, such as aggregate of Stop Error Restarts. Standard deviation and mean are calculated for a sliding window of time, using aggregated metrics. This method allows the model to be sensitive to temporal patterns in the data and adapt to changes in its distribution over time.
Note: The information, about the analytical models used for detecting anomalies, is coming straight from the docs.
Understanding enhanced device timeline
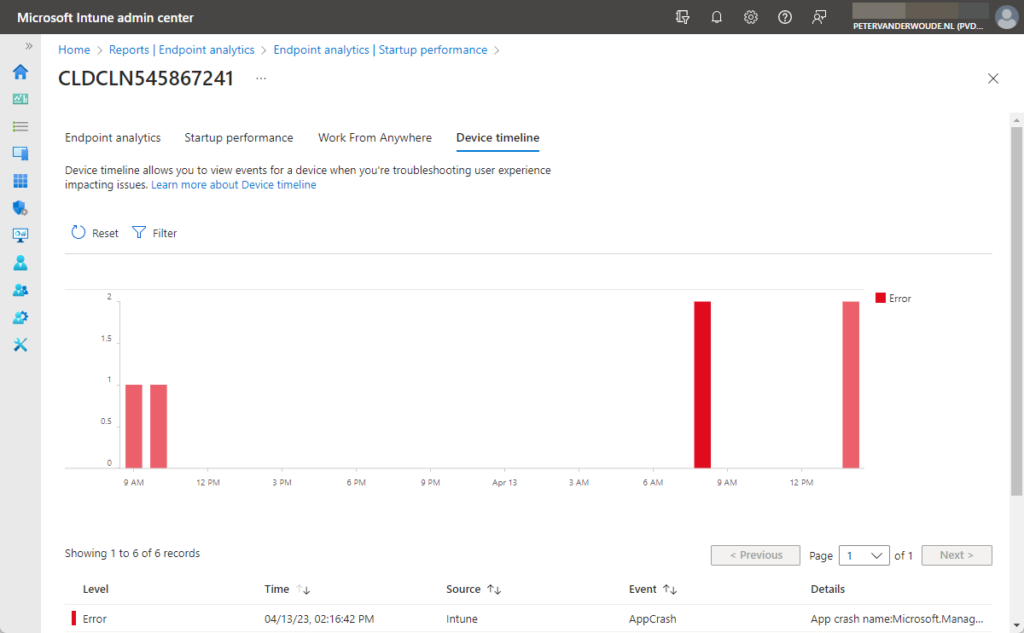
The enhanced device timeline enables IT administrators to see the history of events that have occurred on a specific device. The timeline is available in the details of a Windows devices via User experience > Device timeline. That same timeline can also be reached via Endpoint analytics via Device timeline of a specific device. Information in that timeline can be filtered by using the Filter button and selecting a specific time range. It contains information about app crashes, app unresponsiveness, device boots, device logons, and anomaly detected events. Below in Figure 2 is a brief overview of a device timeline that contains some app crashes. It provides a history of events that have occurred on the selected device.

Note: At this moment, that timeline contains app crash, app unresponsive, device boot, device logon, and anomaly detected events. End-to-end latency is generally under 24 hours.
Working with custom device scope
Custom device scopes enable organizations to filter Endpoint analytics reports to only a subset of devices. That enables IT administrators to only see the scores, insights, and recommendations of that specific subset of devices. The device scopes use Scope tags to make the actual filtering.
Note: At this moment, custom device scopes are supported in the Endpoint analytics reports of Startup performance, Work from anywhere, and Application reliability.
Creating custom device scopes
When looking at using custom device scopes, it all starts by creating custom device scopes. Custom devices scopes are basically a filter based on the Scope tag as a parameter. At this moment that is also the only available parameter. The following three steps walk through the creation of a custom device scope, by relying on a Scope tag.
- Open Microsoft Intune admin center navigate to Reports > Endpoint analytics > Startup performance (or any other supported report within Endpoint analytics)
- Select the Device scope menu, and select Manage device scopes
- On the Manage device scopes blade, as shown below in Figure 3, select a Scope tag and click Save

- On the Saved device scopes dialog, provide a unique name and click OK
- Once created, switch the slider with State to On
Using custom device scopes
After creating the custom device scope, it can take up to 24 hours to process. During that period, the custom device scope is not available for use. After that period, the custom device scope can be used to filter Endpoint analytics reports to a subset of devices. The following two steps walk through using a custom device scope.
- Open Microsoft Intune admin center navigate to Reports > Endpoint analytics > Startup performance (or any other supported report within Endpoint analytics)
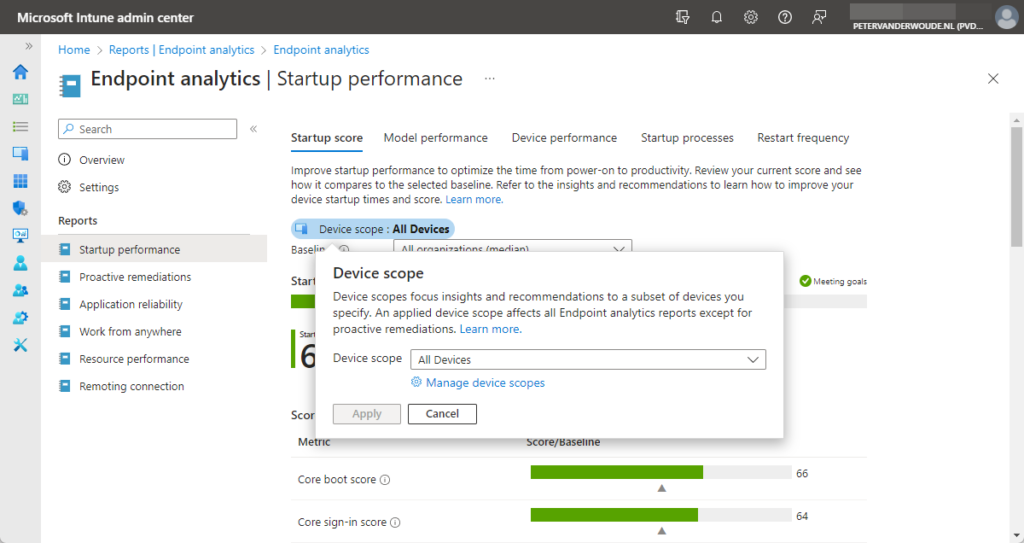
- Select Device scope menu, as shown below in Figure 4, select the required device scope with Device scope and click Apply

More information
For more information about Endpoint Privilege Management, refer to the following docs.
- What is advanced Endpoint analytics – Microsoft Endpoint Manager | Microsoft Learn
- Anomaly detection in Endpoint Analytics – Microsoft Endpoint Manager | Microsoft Learn
- Enhanced device timeline in Endpoint Analytics – Microsoft Endpoint Manager | Microsoft Learn
- Device scopes in Endpoint Analytics – Microsoft Endpoint Manager | Microsoft Learn

2 thoughts on “Getting started with Advanced Endpoint Analytics”